A note on methodology. The author deliberately distinguishes between two levels of knowledge: established facts (results of measurements and observations) and explanations (theoretical interpretations of those facts). The former is beyond doubt. The latter is a matter of scientific debate. The reader is invited to evaluate the arguments independently.
Introduction
The Earth rotates on its axis unevenly. This is not a hypothesis — it is a measurable and repeatedly confirmed fact. Modern geodesy records changes in the length of day (parameter LOD — Length of Day) with microsecond precision. Even deviations of a few milliseconds indicate powerful redistributions of mass and angular momentum within the Earth–atmosphere–ocean system.
LOD measures the deviation of the actual length of day from the reference value (86,400 SI seconds). A positive LOD value means the Earth is rotating slower than normal; a negative value means it is rotating faster.
The question of the nature of this variability remains one of the most fascinating in modern geophysics. The answer is not straightforward.
Part I — FACTS: The Scales of LOD Variability
LOD measurements span more than a century of instrumental observations (astronomical methods since the 19th century; VLBI and GPS since the 1980s). Analysis of these data reveals a clear hierarchy of temporal scales of variability.
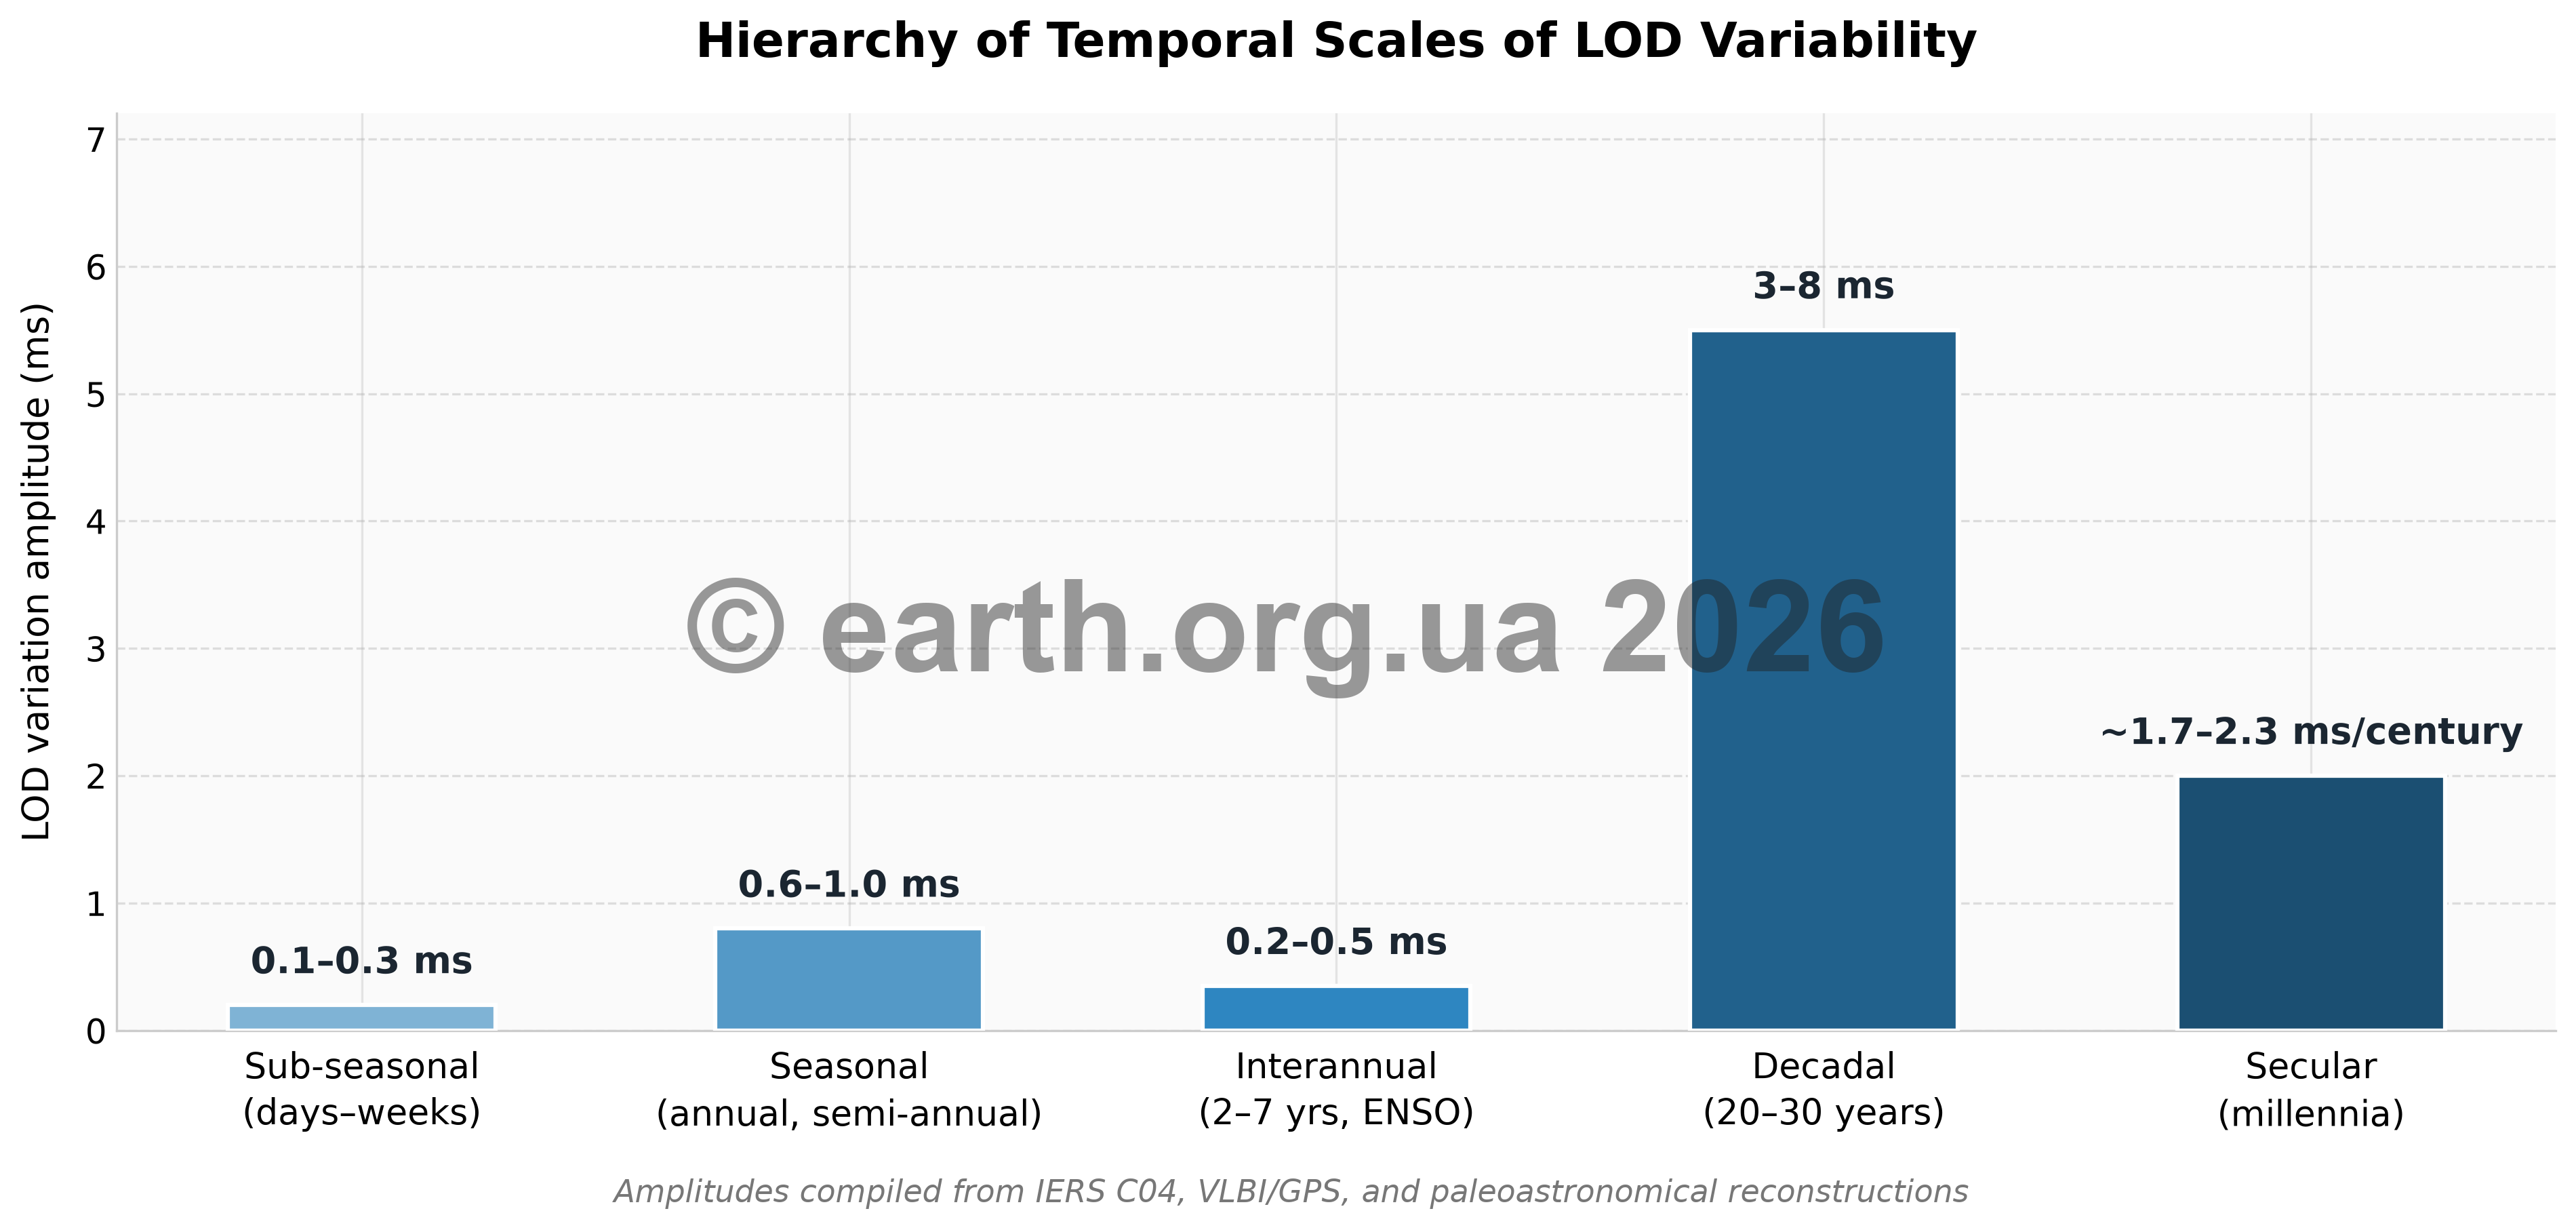 Fig. 1. Amplitudes of LOD variations at different temporal scales (compiled from IERS C04, VLBI/GPS, and paleoastronomical reconstructions).
1. Secular (Millennial) Variability
Fact: The length of day is gradually increasing. According to paleontology (analysis of daily growth rings in ancient corals and molluscs) and paleoastronomy:
- 400 million years ago (Devonian period) — the day lasted ~22 hours.
- 100 million years ago — ~23.5 hours.
- Today — 24 hours.
- Rate of increase: ~1.7–2.3 ms per century (based on IERS C04 data and paleoastronomical reconstructions).
2. Decadal Variability
Fact: On the timescale of decades, LOD varies irregularly by 3–8 milliseconds. These changes do not correlate with seasonal or climatic cycles. LOD time series for 1900–2024 show alternating phases of acceleration and deceleration of rotation lasting 20–30 years.
3. Interannual Variability (2–7 years)
Fact: LOD varies by 0.2–0.5 ms on interannual scales. This variability clearly correlates with ENSO indices (Oceanic Niño Index, Southern Oscillation Index) with a typical time lag of ~1–2 months (Dickey et al., 2007; Xu et al., 2022). The correlation between interannual LOD variations and AAM is statistically robust and reproducible across independent datasets.
4. Seasonal Variability (Annual and Semi-Annual Cycles)
Fact: LOD has a distinct annual cycle with an amplitude of ~0.6–1.0 ms and a semi-annual cycle with an amplitude of ~0.3 ms. The maximum LOD (Earth rotating slowest) occurs in February–March; the minimum occurs in August. This cycle is extremely regular and repeats year after year.
5. Sub-Seasonal and Irregular Variability (Days–Weeks)
Fact: On timescales of weeks, LOD varies irregularly by 0.1–0.3 ms. Sharp LOD jumps have been recorded following major earthquakes (for example, the 2004 Sumatra earthquake, M9.1 — changed LOD by ~2.68 microseconds).
Part II — EXPLANATIONS: What Modern Science Says
For each temporal scale of variability, geophysics offers its own explanation. It is important to remember: explanations are interpretations of facts, not facts themselves.
Secular Variability — The Accepted Explanation
Theory: The slowing of rotation is caused by tidal friction — the Moon’s gravitational influence deforms the oceans, creating a tidal wave that through friction brakes the Earth’s rotation. Simultaneously, angular momentum is transferred to the Moon, which is gradually receding from Earth (~3.8 cm per year).
Level of confirmation: High. The mechanism is theoretically sound, and quantitative estimates agree with paleontological data.
Decadal Variability — The Least Understood Scale
Theory: Explained by interaction between the mantle and the liquid outer core of the Earth. Changes in convective flows of liquid iron in the core transfer angular momentum to the mantle through electromagnetic coupling at the core–mantle boundary.
Level of confirmation: Moderate. There are no direct observations of flows in the core — they are reconstructed indirectly from the geomagnetic field. Quantitative estimates of the transferred angular momentum still do not fully agree with observations.
Interannual and Seasonal Variability — The Atmospheric Explanation
Theory: These scales of variability are explained by the conservation of angular momentum in the solid Earth–atmosphere–ocean system. If the atmosphere accelerates (AAM increases), the solid Earth slows down (LOD increases) — and vice versa.
Seasonal LOD changes are linked to the redistribution of atmospheric masses and the strengthening/weakening of zonal winds (primarily jet streams and trade winds). Interannual changes are linked to ENSO and the restructuring of atmospheric circulation.
Level of confirmation: High for the seasonal scale; moderately high for the interannual scale. The atmospheric component explains ~90% of seasonal LOD changes.
Part III — FACTS: Correlation Between LOD and Atmospheric Circulation
The Seasonal LOD Cycle and Zonal Winds
Established fact: the seasonal LOD cycle is a mirror image of the seasonal cycle of atmospheric angular momentum (AAM). The correlation between LOD and AAM series (from ERA5, NCEP reanalyses) exceeds r=0.95 on the seasonal scale.
In Northern Hemisphere winter:
- Westerly winds at altitudes of 8–12 km (jet streams) intensify.
- Atmospheric AAM increases.
- LOD rises — the Earth slows down.
In summer — the opposite pattern.
Interannual LOD Variations and ENSO: Chronology of Events, 1997–2026
Established mechanism: during El Niño, trade winds weaken and tropical atmospheric circulation in the Pacific Ocean breaks down — AAM increases, LOD increases (the Earth slows). During La Niña, trade winds strengthen — AAM decreases, LOD decreases (the Earth accelerates). The lag between the ENSO peak and the LOD anomaly peak: ~1–2 months (Dickey et al., 2007; Xu et al., 2022).
Response of the Atmosphere–Solid Earth system to the ENSO peak:
Ocean (ENSO peak) → Atmosphere (AAM) and Solid Earth (LOD) respond simultaneously with a lag of ~1–2 months after the ENSO peak
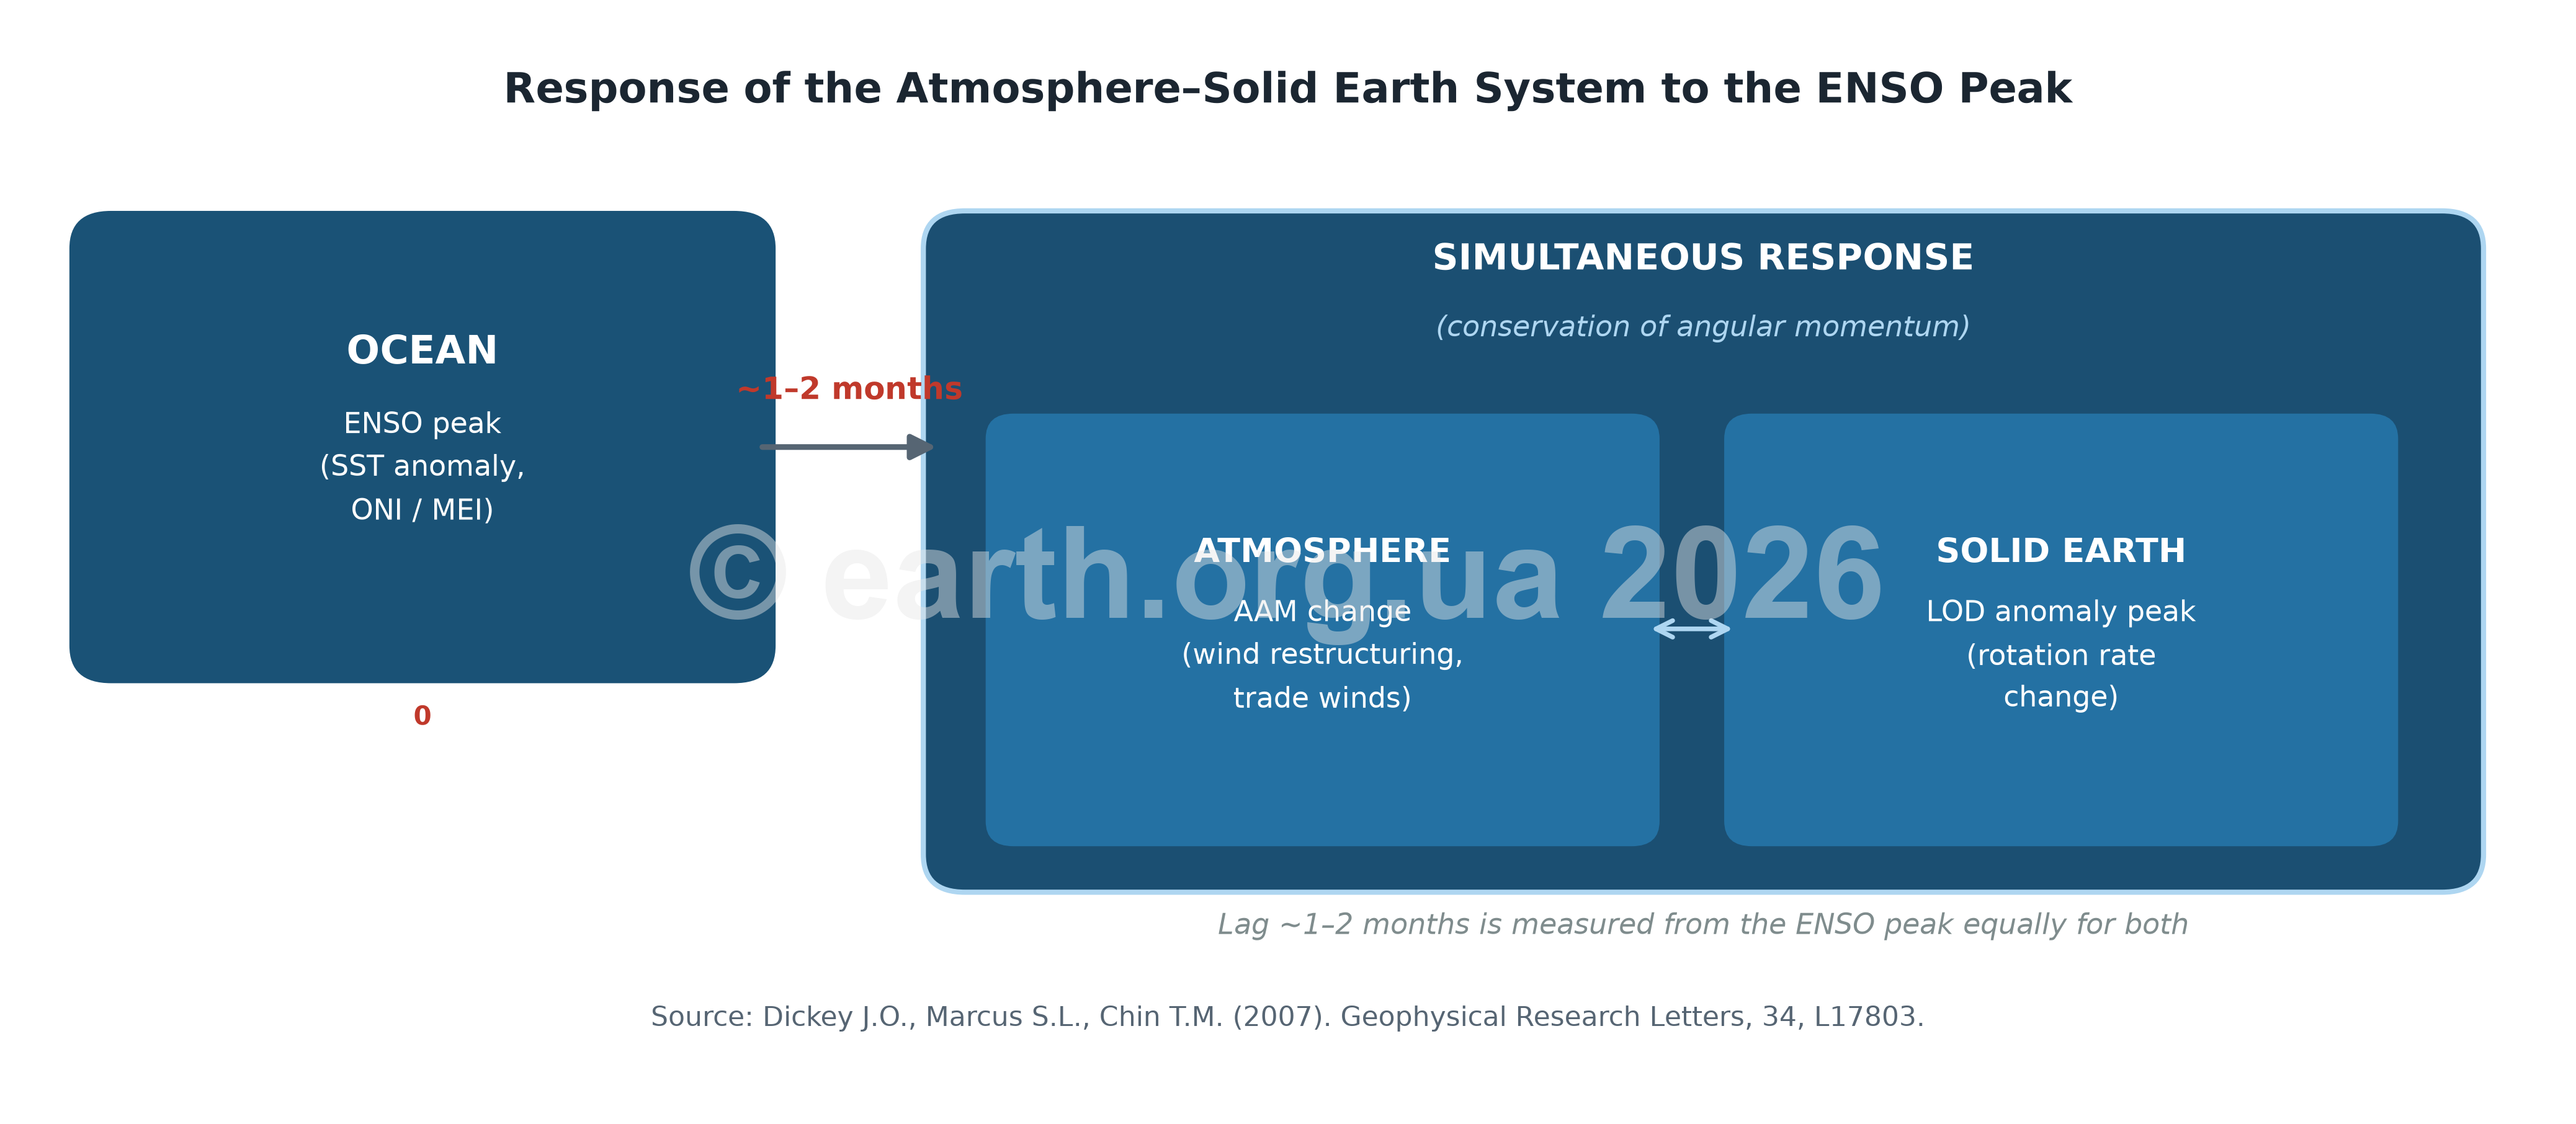 Fig. 2. Diagram of the Atmosphere–Solid Earth system response to the ENSO peak: AAM and LOD both lag the SST peak by ~1–2 months simultaneously (Dickey, Marcus, Chin, 2007, Geophys. Res. Lett., 34, L17803).
Important detail: AAM and LOD lag the ENSO peak simultaneously — both quantities respond with a lag of ~1–2 months. The transition AAM → LOD occurs nearly instantaneously through conservation of angular momentum, with no additional delay between them. The ~1–2 month lag between the ENSO peak and the LOD anomaly peak is due to the time required to build up the tropical temperature gradient (TT), which is the direct source of the thermal winds that drive AAM and LOD changes (Dickey et al., 2007).
Below is an extended chronology of the most pronounced events for the period 1997–2026.
El Niño 1997–1998: Record Event of the 20th Century
The most powerful El Niño in the instrumental observation record. ONI peak: +2.3°C (November–December 1997). The event caused a large-scale restructuring of global atmospheric circulation.
- LOD anomaly: +0.6–+0.75 ms above normal — one of the largest recorded on the interannual scale
- AAM: sharp increase due to the collapse of trade winds and strengthening of westerlies in the troposphere
- This event, together with El Niño 2015–2016, is the benchmark example of the link between extreme ENSO events and LOD anomalies; the LOD change was approximately 750 µs·d⁻¹
- The event is recognized as the climatic event of the 20th century in terms of its scale and global consequences
La Niña 1998–2000: Rapid Transition
The rapid transition from a record El Niño to a prolonged La Niña is a classic example of the Pacific Ocean’s discharge–recharge cycle.
- LOD anomaly: −0.3–−0.4 ms — the Earth accelerated
- AAM: noticeable decrease due to the restoration and strengthening of trade winds
- The transition from the LOD maximum (1997–1998) to the minimum (1999–2000) amounted to more than 1 ms over ~18 months — a vivid illustration of the scale of interannual variability.
2000–2010: Detailed Chronology
| Year | ENSO Phase | Intensity | LOD Anomaly | AAM Change |
|---|---|---|---|---|
| 2000 | La Niña | Strong | −0.2–−0.3 ms | Decrease |
| 2001 | Neutral | — | ~0 ms | Normal |
| 2002–2003 | El Niño | Moderate (Modoki) | +0.2–+0.3 ms | Increase |
| 2004–2005 | Neutral | — | ~0 ms | Normal |
| 2006–2007 | El Niño | Weak (Modoki) | +0.1–+0.2 ms | Moderate increase |
| 2007–2008 | La Niña | Moderate | −0.1–−0.2 ms | Decrease |
| 2009–2010 | El Niño | Moderate (Modoki) | +0.2–+0.3 ms | Increase |
A notable feature of the 2000–2010 decade is the emergence of “Modoki”-type ENSO events (central Pacific type): El Niño 2002–2003, 2006–2007, 2009–2010 — these events had a different spatial distribution of SST anomalies than classical El Niño, which was also reflected in the character of AAM and LOD anomalies.
La Niña 2010–2011: One of the Strongest on Record
MEI peak: −2.4 (June–July 2010) — the strongest La Niña reading since 1979 by this index.
- LOD anomaly: −0.3–−0.4 ms — pronounced acceleration of Earth’s rotation
- AAM: significant decrease due to a sharp strengthening of trade winds and tropical circulation
- MEI (Multivariate ENSO Index): −2.4 (June–July 2010). The MEI is a composite ENSO index developed by NOAA which, unlike the ONI (sea surface temperature only), simultaneously considers 6 parameters: sea surface temperature, sea level pressure, zonal and meridional wind, air temperature, and cloudiness. Negative MEI values correspond to La Niña. A value of −2.4 is among the lowest in the instrumental record (since 1979) and indicates exceptional event intensity by a comprehensive assessment of the oceanic and atmospheric state.
- La Niña 2010–2011 led to large-scale floods in Australia, Pakistan, and Brazil — a vivid example of the link between the state of global atmospheric circulation and extreme weather events.
Neutral and Transitional Period 2011–2014
A relatively neutral ENSO phase with brief weak departures. LOD exhibited primarily seasonal variability with an amplitude of 0.6–0.8 ms. Interannual anomalies were weakly expressed (~0.1 ms). Notably, in 2014 there were precursors of El Niño (anomalous warming of the central Pacific), but a full-scale event did not develop — a rare example of an “aborted” El Niño.
El Niño 2015–2016: Record of the 21st Century
The most powerful El Niño of the 21st century and one of the two strongest in the instrumental record (together with 1997–1998). ONI peak: +2.6°C (November–December 2015) — an absolute record by this index.
- LOD anomaly: +0.6–+0.75 ms — comparable to the 1997–1998 event; LOD change ~750 µs·d⁻¹
- AAM: sharp increase due to the collapse of trade winds, strengthening of equatorial westerlies, and large-scale restructuring of tropical circulation
- 2016 became at the time the warmest year in the instrumental record — in part due to El Niño’s effect on global temperature
- After the peak, a rapid transition to La Niña 2016–2017 followed
La Niña 2016–2017 and the Neutral Period 2017–2019
- LOD anomaly: −0.2–−0.3 ms in 2016–2017
- Then a neutral phase: LOD close to climatological normal, with the seasonal cycle dominant
La Niña 2020–2023: A Unique “Triple-Dip” Event
An exceptional event in terms of duration: three consecutive years of La Niña (2020–2021, 2021–2022, 2022–2023) — a “triple-dip La Niña”, the first such occurrence since the 1970s. Simultaneously, a record-length Negative Indian Ocean Dipole (nIOD) 2021–2022 was observed (19 months).
- LOD anomaly: persistently negative throughout 2020–2023, −0.2–−0.3 ms
- AAM: prolonged decrease, associated with strengthening of trade winds over the Pacific
El Niño 2023–2024: Temperature Records
A strong El Niño with an ONI peak of ~+2.0°C (late 2023 – early 2024). In combination with the long-term warming trend:
- LOD anomaly: +0.3–+0.5 ms.
- AAM: noticeable increase.
- 2023 and 2024 became record-warm years in global temperature statistics.
Status 2025–2026: A New Developing El Niño
Following a relatively neutral phase in 2024–2025, a new El Niño is forming in 2026. As of June 2026:
- Official NOAA CPC status: El Niño Advisory — El Niño conditions are confirmed and ongoing
- Niño 3.4 index: +1.7°C (June 17, 2026) and continuing to rise
- LOD anomaly: expected to grow to +0.3–+0.5 ms in the second half of 2026
- Forecast: 13 of 24 climate models indicate a very strong event with a peak in SON 2026 (Niño 3.4 ≥ +2.0°C); ECMWF forecasts an anomaly of up to +3°C by December 2026.
- If the forecast is realized — potentially the most powerful El Niño in the instrumental record
Summary Table 1997–2026 (based on NOAA ONI, MEI, and IERS/VLBI data)
Note on ENSO intensity classification (by ONI): weak 0.5–0.9°C; moderate 1.0–1.4°C; strong 1.5–1.9°C; very strong ≥2.0°C. Note on LOD anomalies: values are interannual LOD anomalies after removal of the seasonal cycle and tidal components. Sources: IERS Bulletin B, VLBI (Gipson 2016), Yu et al. (2021).
| Period | ENSO Phase | Class by ONI | ONI Peak (°C) | ΔLOD Anomaly (ms) | Notes |
|---|---|---|---|---|---|
| 1997–1998 | El Niño | Very Strong | +2.3 (Nov.–Dec. 1997) | +0.70–+0.75 | 20th century record; ~750 µs·d⁻¹ by VLBI |
| 1998–1999 | La Niña | Strong | −1.6 | −0.25–−0.35 | Rapid transition from EN peak |
| 1999–2000 | La Niña | Strong | −1.7 | −0.25–−0.35 | Prolonged cold phase |
| 2000–2001 | La Niña | Weak | −0.8 | −0.10–−0.15 | Decay |
| 2001–2002 | Neutral | — | ~0 | ~0 | Seasonal cycle dominant |
| 2002–2003 | El Niño | Moderate (Modoki) | +1.2 | +0.15–+0.25 | Central Pacific type |
| 2003–2006 | Neutral | — | ~0 | ~0 | |
| 2006–2007 | El Niño | Weak (Modoki) | +0.8 | +0.08–+0.15 | |
| 2007–2008 | La Niña | Moderate | −1.4 | −0.15–−0.25 | |
| 2008–2009 | La Niña | Weak | −0.8 | −0.08–−0.15 | |
| 2009–2010 | El Niño | Moderate (Modoki) | +1.3 | +0.15–+0.25 | |
| 2010–2011 | La Niña | Strong | −1.7 (MEI −2.4) | −0.25–−0.35 | Australia floods; MEI record |
| 2011–2012 | La Niña | Moderate | −1.1 | −0.15–−0.20 | |
| 2012–2014 | Neutral | — | ~0 | ~0 | |
| 2014–2015 | El Niño | Weak | +0.6 | +0.05–+0.10 | “Aborted” EN 2014 → weak EN |
| 2015–2016 | El Niño | Very Strong | +2.6 (Nov.–Dec. 2015) | +0.70–+0.75 | ONI record; ~750 µs·d⁻¹ by VLBI; T record 2016 |
| 2016–2017 | La Niña | Weak | −0.7 | −0.08–−0.15 | |
| 2017–2019 | Neutral | — | ~0 | ~0 | |
| 2019–2020 | El Niño | Weak | +0.5 | +0.05–+0.10 | |
| 2020–2021 | La Niña | Moderate | −1.2 | −0.15–−0.20 | 1st year of triple-dip |
| 2021–2022 | La Niña | Moderate | −1.0 (MEI −2.2) | −0.15–−0.20 | 2nd year; record nIOD |
| 2022–2023 | La Niña | Weak | −0.6 | −0.08–−0.12 | 3rd year of triple-dip |
| 2023–2024 | El Niño | Strong | +2.0 (Nov.–Dec. 2023) | +0.35–+0.50 | T record 2023 and 2024 |
| 2024–2025 | Neutral | — | ~0 | ~0 | Transitional period |
| 2025–2026 | El Niño | Developing → forecast: very strong | +1.7 (Jun. 2026) and rising | +0.30–0.50 (expected) | NOAA Advisory; 63% probability ONI ≥+2.0 by winter 2026–27 |
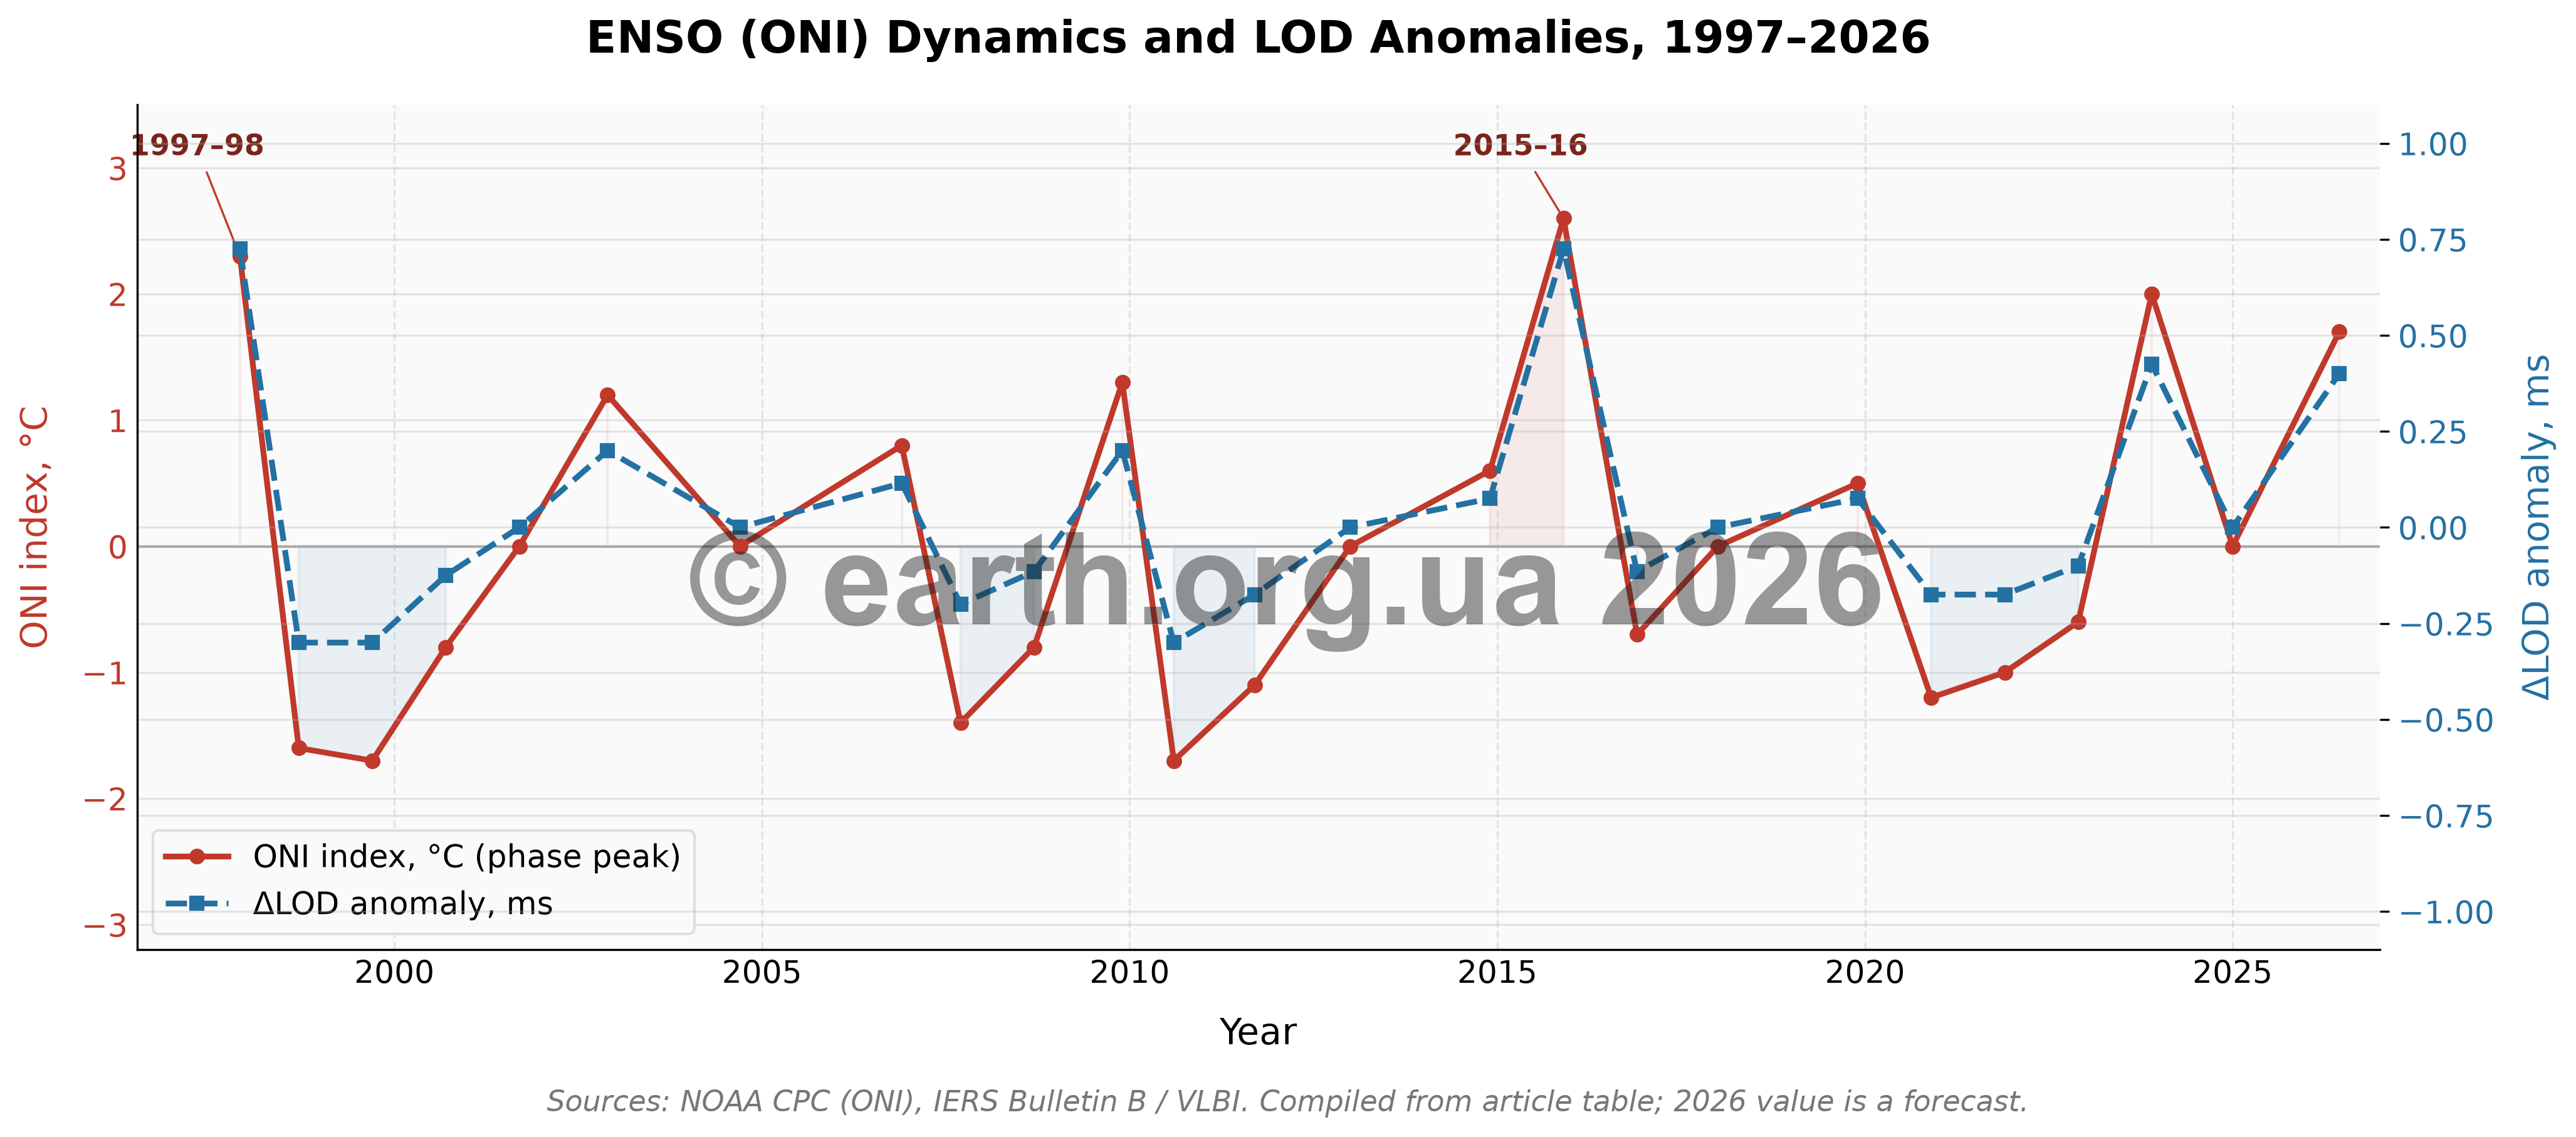 Fig. 3. Parallelism of ENSO (ONI) peaks and LOD anomalies for the period 1997–2026 (compiled from the table data; the 2026 value is a forecast).
Consistent pattern over 1997–2026: El Niño → LOD increases. La Niña → LOD decreases. Neutral phase → seasonal cycle dominant. This pattern reproduces independently of the decade and is one of the most reliably established facts in the geophysics of Earth’s rotation.
These LOD anomalies are synchronised with changes in atmospheric circulation indices: NAO (North Atlantic Oscillation), AO (Arctic Oscillation), MJO (Madden–Julian Oscillation).
Long-Term LOD Trend and Climate Change
Fact: Analysis of the LOD series for 1962–2024 reveals a weak but statistically significant positive trend (increasing LOD) in the second half of the 20th century and the early 21st century, superimposed on decadal variability. Simultaneously, accelerating glacier melt and rising global sea level are recorded.
Explanation (mainstream science): The redistribution of water masses from the poles to the equator increases the Earth’s moment of inertia and slows its rotation.
Open question: How precisely do quantitative estimates of melted glacier mass account for the observed LOD trend? Are there other unexplained causes that may be influencing these phenomena?
Part IV — CRITICAL ANALYSIS AND ALTERNATIVE HYPOTHESES
The accepted explanations for LOD variability are well developed and quantitatively substantiated. However, a number of observed facts lie outside standard models, or are explained by them only partially.
Unexplained Residuals in the Total Angular Momentum Budget
The atmospheric and oceanic components account for most of the seasonal and interannual LOD changes. However, after excluding known excitation sources, an unexplained residual remains — particularly on interannual and decadal scales. Its nature is still a matter of debate.
Astronomical Factors — An Underestimated Role?
Standard LOD models account for the Moon’s influence (tidal friction) and the Sun’s (solar-diurnal and lunar-diurnal tides). However:
- Planetary configurations — do gravitational perturbations from the major planets (Jupiter, Saturn) affect the distribution of mass in the atmosphere and in the Earth’s liquid core? This topic remains poorly studied.
- Solar activity and LOD — a number of authors point to correlations between the 11-year solar cycle and LOD changes. The mechanism — a possible influence of the solar wind on the upper atmosphere and through it on AAM. The quantitative magnitude of this contribution remains uncertain.
- Heliocentric and geocentric orbital parameters — variations in the Earth–Sun distance (3.3% over the year), axial tilt, precession and nutation are well-studied astronomical facts. However, their indirect influence on LOD through the redistribution of atmospheric masses may be underestimated in standard models.
Geophysical Processes Inside the Earth — Open Questions
- Mantle convection — slow convective flows in the mantle change mass distribution and can affect LOD on geological timescales. Their influence on the decadal scale is a matter of debate.
- The connection between LOD and the geomagnetic field — decadal LOD variability and long-period changes in the geomagnetic field show a certain parallelism. This points to a common source — processes in the liquid core. However, the quantitative description of this link is still unsatisfactory.
- Seismic activity and LOD — some studies point to statistical links between global seismicity and LOD changes. Cause-and-effect relationships (does LOD affect seismicity or vice versa) remain a subject of debate.
- Geoid shape changes — the redistribution of masses inside the Earth changes the geoid’s shape and the planet’s moment of inertia. Is there a feedback between LOD changes and geoid evolution?
An Alternative View: LOD as an Indicator Rather Than a Consequence
Traditionally, LOD is viewed as a consequence of atmospheric, oceanic, and core influences. An alternative viewpoint: some LOD changes may be precursors or indicators of deeper geophysical and astronomical processes that subsequently manifest in atmospheric circulation changes.
If external (astronomical) factors simultaneously affect both the Earth’s rotation and its atmosphere — then the correlation between LOD and AAM may not be causal, but rather a synchronous response to a shared external signal. This is a fundamentally different interpretation of the same facts.
An invitation to reflection. What are the limits of standard models? Do we truly know why LOD changes — or do we only describe how? The answer to this question determines the direction of future research.
Author’s Observations and Publications
During 2005–2017, the author, in collaboration with colleagues (B.B. Kapochkin and others), conducted a series of studies on the connection between the Earth’s rotation rate, gravitational field, and atmospheric circulation. The key results of these studies are presented below.
Synchronism of the Seasonal ω Variability and Circulation Seasons
A comparison of the graph of average seasonal fluctuations of the Earth’s rotation rate (ω, after K.A. Kulikov, 1985, p. 160) with the average dates of circulation seasons according to B.L. Dzerdzeevsky’s classification (Kononova N.K., 2009) revealed their nearly simultaneous variability: each seasonal change in ω corresponds to its own circulation season in the atmosphere. In particular:
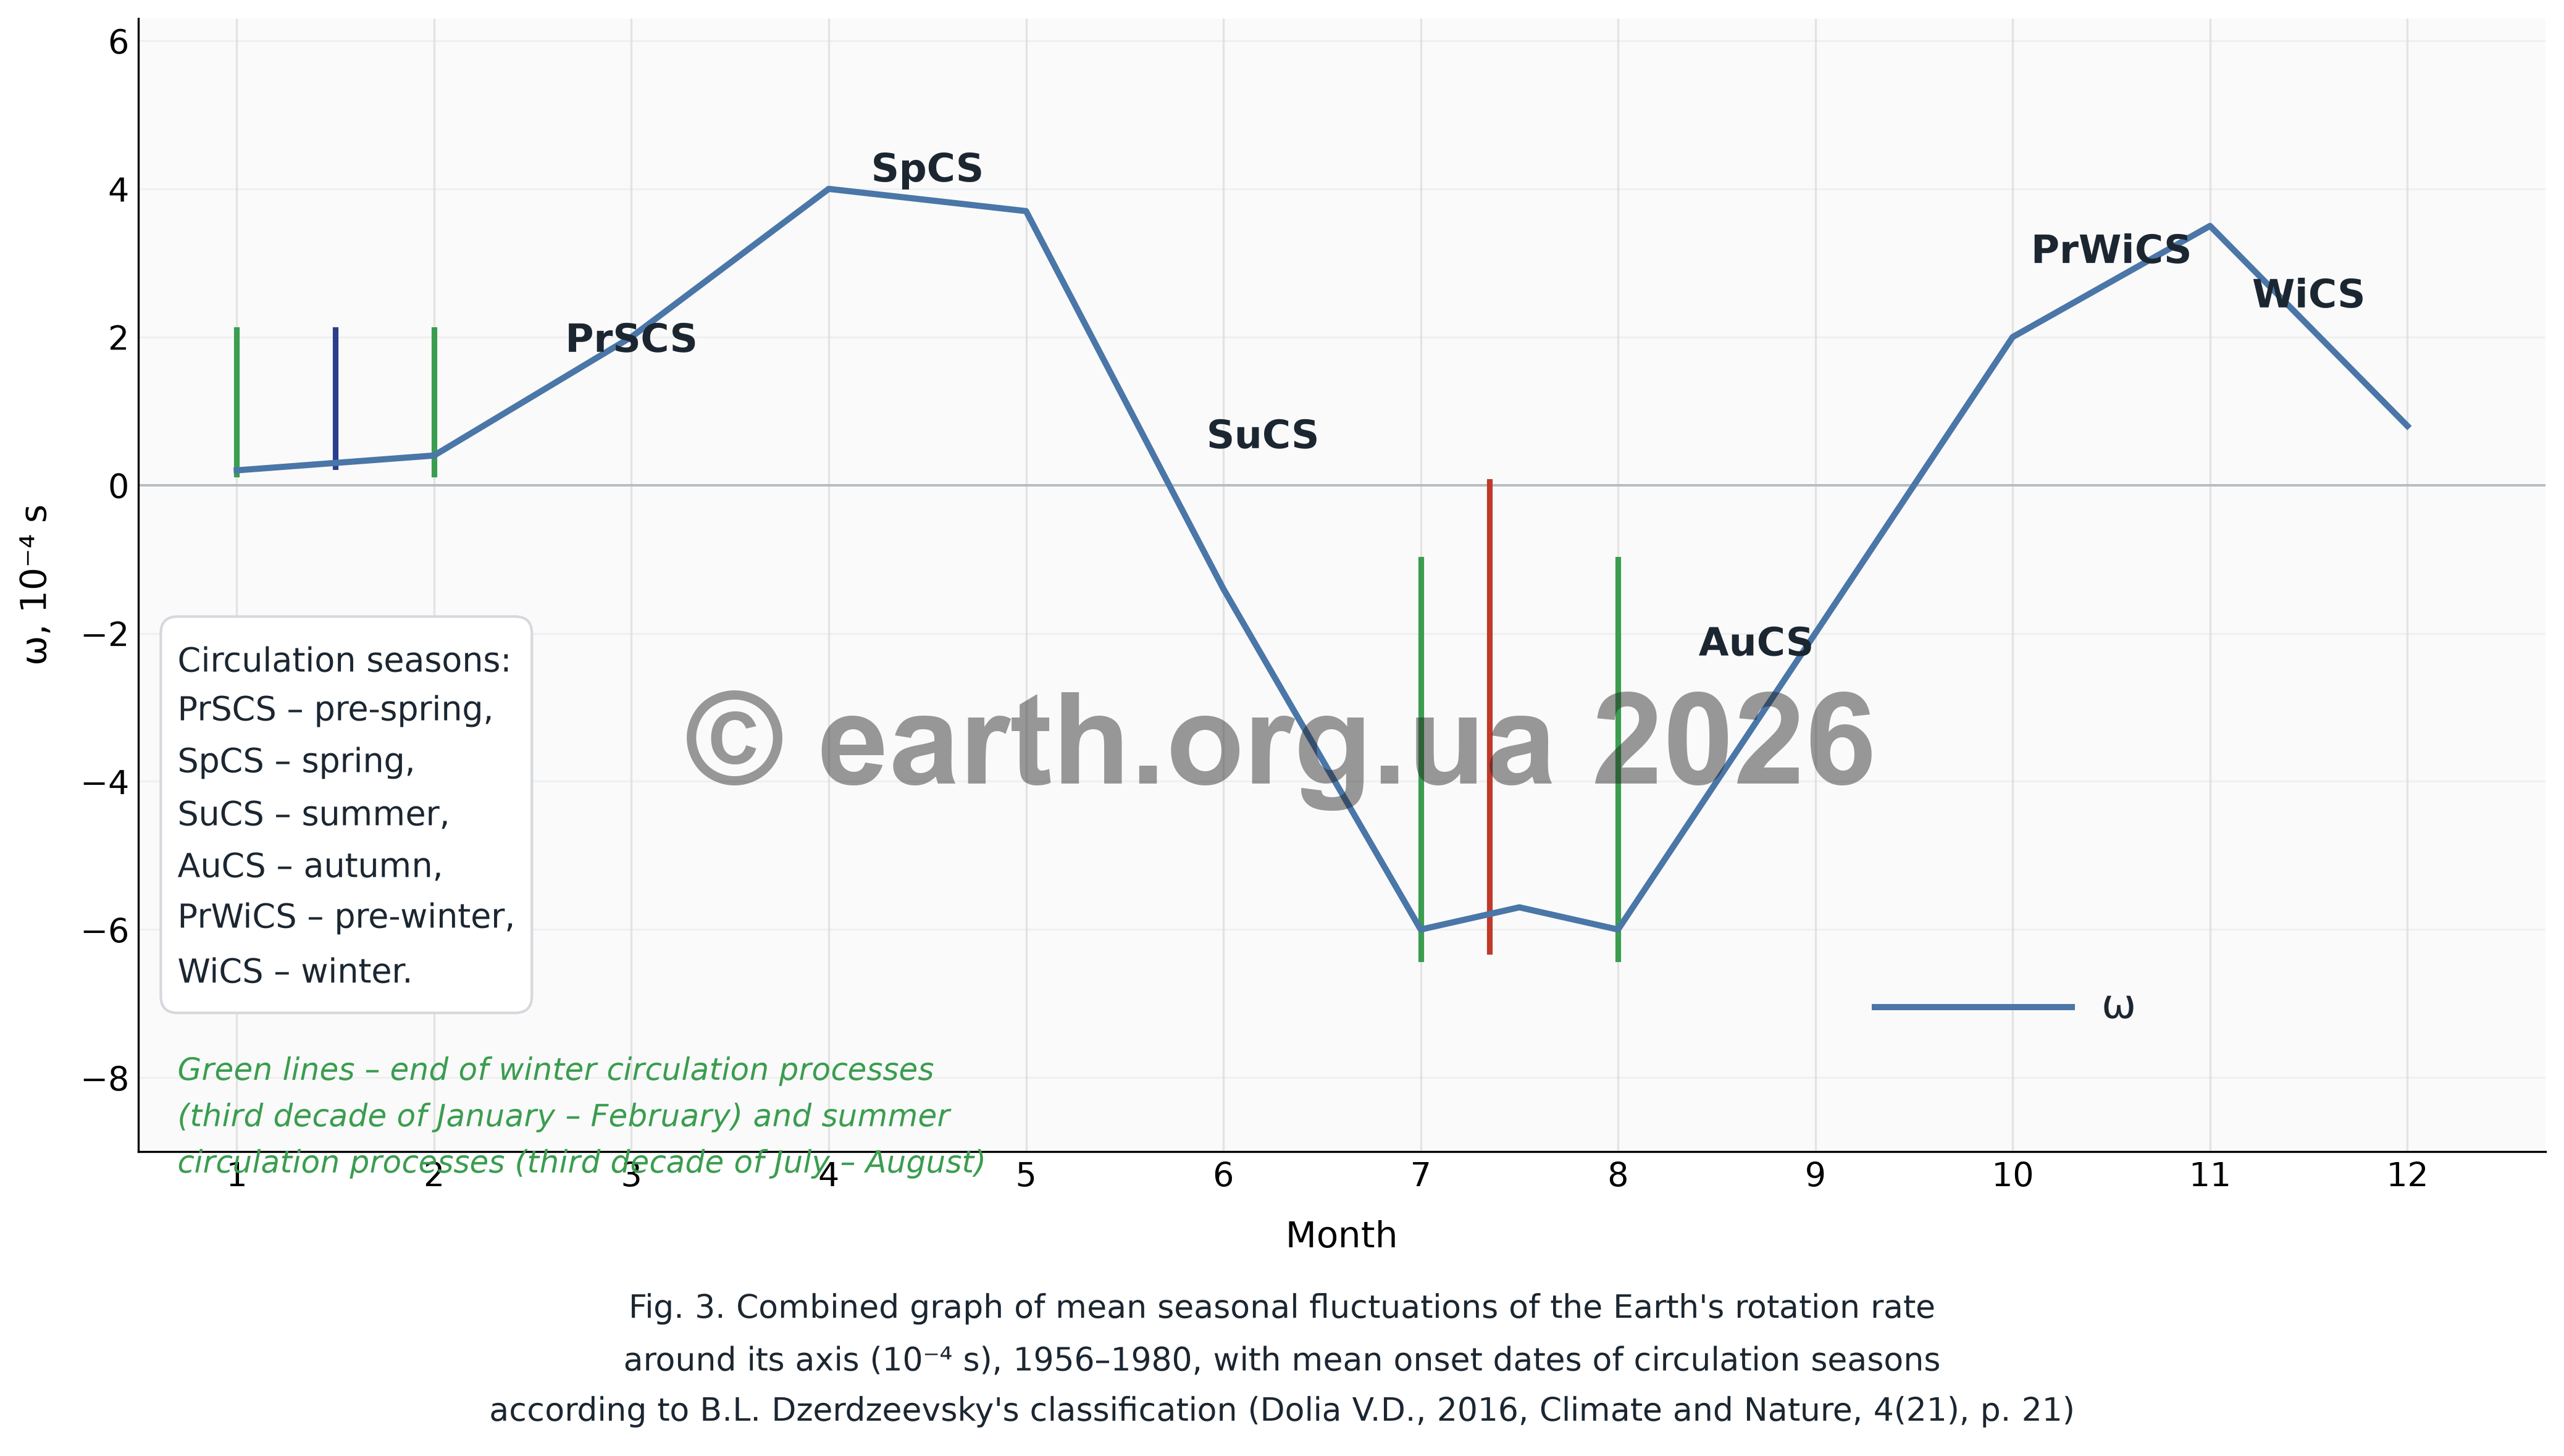 Fig. 4. Combined graph of average seasonal fluctuations of the Earth’s rotation rate around its axis (10⁻⁴ s), from 1956 to 1980, with the average dates of onset of circulation seasons according to B.L. Dzerdzeevsky’s classification (Dolia V.D., 2016, “Klimat i Priroda” [Climate and Nature], 4(21), p. 21).
- The maximum recurrence of winter circulation groups falls in the first decade of February; summer groups — at the beginning of the third decade of July.
- These maxima and minima in the general atmospheric circulation (GAC) are synchronous with the trends of annual variability of the Earth’s rotation rate and the seasonal cycle of the “New Global Mode of Geodeformations” (detected by satellite measurements and published in Science, 2001).
- The difference between the inflection points of solar radiation inflow and the change in circulation patterns amounts to 2–3 months in winter and up to 1.5 months in summer — indicating that solar insolation is not the sole factor governing changes in circulation patterns.
The Unifying Forces of Planetary Processes
The synthesising conclusion of the research series: the unifying forces for planetary geophysical and atmospheric processes are the variability of Earth’s rotation rate (ω), the deformation of geoid shape, and the variability of the planet’s gravitational field at global and regional scales. Oscillations of these three interrelated parameters lead to changes in the circulation of the World Ocean and the general circulation of the atmosphere throughout its entire depth, resulting in climatic variability.
Detailed analysis and figures will be presented in separate publications in the Research section.
Conclusions
LOD variability is a multi-scale phenomenon with its own hierarchy of temporal scales: from microsecond sub-seasonal fluctuations to millisecond decadal changes and microsecond secular increase.
Facts about LOD variability and its correlation with atmospheric circulation are well established and reproducible.
Explanations. Standard models (tidal friction, core–mantle interaction, conservation of angular momentum in the Earth–atmosphere–ocean system) account for most of the observed variability, but leave unexplained residuals.
Open questions — the role of astronomical factors, the link to the geomagnetic field, the nature of decadal changes, the possible synchronous (rather than causal) nature of LOD–AAM correlations — define the prospects for future research.
LOD is one of the most informative integral indicators of the state of the planet — and at the same time one of the least unambiguously interpreted.
Sources and Recommended Reading
Classic Monographs
- Lambeck, K. (1980). The Earth’s Variable Rotation. Cambridge University Press.
- Lambeck, K. (1980). Changes in length-of-day and atmospheric circulation. Nature, 286, 104–105.
- Munk, W.H., MacDonald, G.J.F. (1960). The Rotation of the Earth. Cambridge University Press.
- Moritz, H., Mueller, I.I. (1987). Earth Rotation: Theory and Observation. Ungar, New York.
Atmospheric Angular Momentum and ENSO
- Dickey, J.O. et al. (1994). Angular momentum exchange — case study of El Niño 1982–1983. J. Geophys. Res., 99, 23921.
- Hide, R., Dickey, J.O. (1991). Earth’s variable rotation. Science, 253, 629–637.
- Höpfner, J. (2000). Interannual variations in LOD and AAM with respect to ENSO/QBO. GFZ Potsdam.
- Yu, N. et al. (2021). Analysis of Relationships Between ENSO Events and AAM Variations. Earth and Space Science, 8(2). DOI: 10.1029/2021EA002030
- Zhou, Y.H. et al. (2006). Relationship between ENSO and Earth’s rotation. Journal of Geodesy, 80, 385–392.
LOD and Climatic Predictability
- Gross, R.S. (2007). Earth rotation variations — long period. Treatise on Geophysics, 3, 239–294.
- Martínez-Asensio, A. et al. (2022). Long-range predictability of extratropical climate and LOD. Nature Geoscience, 15, 917–923.
- Chao, B.F., Yan, H. (2010). Relation between LOD variation and angular momentum of geophysical fluids. J. Geophys. Res., 115, B10417.
- Salstein, D.A. (2000). Modulation of the seasonal cycle in LOD and AAM. Springer.
- Dickey, J.O., Marcus, S.L., Chin, T.M. (2007). Thermal wind forcing and atmospheric angular momentum: Origin of the Earth’s delayed response to ENSO. Geophysical Research Letters, 34, L17803.
- Xu, X.Q. et al. (2022). Contributions of oceanic and continental AAM to interannual variation in ΔLOD. Journal of Geodesy, 96, 43.
Data Sources
- IERS Bulletin B: iers.org/bulletins
- NOAA CPC — ENSO indices: cpc.ncep.noaa.gov
- ESMGFZ — AAM data: esmgfz.gfz-potsdam.de
Author’s Publications
- Dolia, V., Dolia, I. (2006). The global changes and influencing factors. Geophysical Research Abstracts, Vol. 8, EGU06-A-00772.
- Kapochkin, B., Dolia, V., Dolia, I. (2006). Example of influence of geodynamic processes on the common circulation of the atmosphere. 6th Annual Meeting of the EMS / 6th ECAC, EMS2006-A-00216.
- Kapochkin, B., Dolia, V. (2007). Current global rise of temperature in conditions of anomalous changes of the Earth form. Geophysical Research Abstracts, Vol. 9, EGU2007-A-04983.
- Kapochkin, B., Kucherenko, N., Dolia, V. (2007). Global warming as a result of total action of anthropogenic and geothermic factors. Geophysical Research Abstracts, Vol. 9, EGU2007-A-00614.
- Kapochkin, B., Dolia, V. (2008). Research of the earlier unknown natural phenomenon. Geophysical Research Abstracts, Vol. 10, EGU2008-A-10960.
- Dolia, V. (2008). The gravitational theory of baric formations. Geophysical Research Abstracts, Vol. 10, EGU2008-A-11100.
- Dolia, V.D., Kucherenko, N.V., Kapochkin, B.B. (2015). The influence of temporal variability of the gravitational field on the atmosphere and ocean. ScienceRise, 2(1), 30–34.
- Dolia, V.D. (2016). Manifestation of geophysical properties of the Earth in the regularities of atmospheric circulation processes and their correlation with the nature of the Dzerdzeevsky classification [in Russian]. Klimat i Priroda [Climate and Nature], 4(21), 18–32.
- Dolia, V.D. (2017). Features of the variability of global-scale meteorological processes (climate) under changing geophysical conditions (gravitational field and Earth’s rotation rate). First All-Ukrainian Hydrometeorological Congress, 202.